What the same audience costs at list price.
Live delivery is billed per copy, and every viewer is a copy. Put in your peak audience and see what a month of unicast delivery costs at the public list prices of the large clouds. Then bring your real bill; most broadcasters pay less than list, and our offer is set against what you actually pay.
A month of unicast delivery
1,0001,000,000
5%100%
1 Mbps20 Mbps
1 h24 h
US dollars per gigabyte, what you actually pay. Worked out in your browser; nothing is sent or stored.
One region: the whole month is priced on its tiers.
One zone: the whole month is priced on its tiers.
- At your own rate put your rate in the box above and this becomes your own number, not a list price
- Traffic per month 6,034,970 GB billed · 1 GB = 1,073,741,824 bytes
Where that lands on Viewcast
- Launch delivery, with the traffic included · billed on your 95th percentile, which is lower than your peak
- Add a channel playout per channel, on top of delivery. Modules and bundle discounts are on the pricing page.
The ladder is set on sustained audience, so a short spike does not move you up a step. Put in your peak and this is the step you would not exceed. See the whole price list
The ceiling: what it would cost at published list prices
- At Amazon CloudFront list price $161,424 egress + $1,728 requests · United States · list price
- At Azure CDN list price first 1,000 TB only · Zone 1 — North America, Europe, Middle East & Africa · list price
And the part the egress price leaves out: moving the signal between regions
- Unicast, crossing inside the cloud one region, nothing crosses a boundary
- One copy to each region one region, nothing to send on
Tick a second region to see this line move. Both figures use the same published rate of $0.0200 per GB for traffic between Amazon regions; what differs is how much has to cross.
— an assumption, not a measurement: it stands for cache misses and replication between regions. Set it to what your own logs say.
Traffic per month (bytes) = peak × share × bitrate (bit/s) ÷ 8 × hours × 3,600 × 30 = 10,000 × 40% × 5,000,000 ÷ 8 × 24 × 3,600 × 30 = 6,480,000,000,000,000 bytes, which is 6,034,970 GB, or 5,893.5 TB, at 1 GB = 1,073,741,824 bytes.
If you already know your rate per gigabyte, the only number that matters is the one on the left. If you do not, bring your bill and we will work it out together.
Public list prices for egress in United States (Amazon CloudFront) and Zone 1 — North America, Europe, Middle East & Africa (Azure CDN), as published on 18 September 2026 (sources below). Tiered rates applied per month. Your negotiated rate is lower; this is the ceiling, not your bill. Above a few hundred terabytes a month, nobody buys at list price: you negotiate, and the gap between list and what you pay is an order of magnitude, not a rounding error. That is why the figures above are a ceiling. Put in what you actually pay and the comparison becomes yours.
The Azure table stops at 1,000 TB a month. At these settings 4,893.5 TB of the traffic has no published rate, so the Azure figure covers the first 1,000 TB and is not a whole month’s bill.
How the list price is applied
Both providers bill egress in tiers that reset every calendar month: the first block of traffic is charged at the first rate, the next block at the next rate, and so on. The calculator walks the published table in order and charges each block at its own rate. Volumes are converted at 1 GB = 1,073,741,824 bytes, the convention the published tables use, which is why the first tier reads 10,240 GB rather than 10,000.
Requests are counted at one segment request per viewer every 6 seconds, which is an assumption about how the stream is packaged, not a measurement: 1,728,000,000 requests at $0.01 per 10,000 HTTPS requests = $1,728.
| Tier | Rate | Billed at this rate | Cost |
|---|---|---|---|
| 0 – 10,240 GB | $0.085 per GB | 10,240 GB | $870 |
| 10,240 – 51,200 GB | $0.08 per GB | 40,960 GB | $3,277 |
| 51,200 – 153,600 GB | $0.06 per GB | 102,400 GB | $6,144 |
| 153,600 – 512,000 GB | $0.04 per GB | 358,400 GB | $14,336 |
| 512,000 – 1,048,576 GB | $0.03 per GB | 536,576 GB | $16,097 |
| 1,048,576 – 5,242,880 GB | $0.025 per GB | 4,194,304 GB | $104,858 |
| over 5,242,880 GB | $0.02 per GB | 792,090 GB | $15,842 |
| Egress total $161,424 · requests $1,728 · together $163,152 | |||
| Tier | Rate | Billed at this rate | Cost |
|---|---|---|---|
| 0 – 10,240 GB | $0.081 per GB | 10,240 GB | $829 |
| 10,240 – 51,200 GB | $0.075 per GB | 40,960 GB | $3,072 |
| 51,200 – 153,600 GB | $0.056 per GB | 102,400 GB | $5,734 |
| 153,600 – 512,000 GB | $0.037 per GB | 358,400 GB | $13,261 |
| 512,000 – 1,024,000 GB | $0.028 per GB | 512,000 GB | $14,336 |
| Total $37,233 for the first 1,000 TB | |||
Sources
- Amazon CloudFront, data transfer out to internet, on demand. Read from the AWS Price List API, offer AmazonCloudFront; the offer file carries publication date 16 September 2026, 13:22:08 UTC. pricing.us-east-1.amazonaws.com/offers/v1.0/aws/AmazonCloudFront/current/index.json
- Azure Content Delivery Network from Microsoft (classic), standard outbound data transfer. Read from the published Azure CDN pricing page, which carries no publication date of its own. azure.microsoft.com/en-us/pricing/details/cdn/
- Google Cloud CDN is not on this page. Its published table could not be read with certainty on 18 September 2026, and a rate is never guessed, so the provider is left out rather than estimated.
Every figure above is a published list price, not what any named customer pays, and not a Viewcast price.
Where we start, and what it saves
We work with broadcasters and platforms from about 10,000 peak concurrent viewers. Below that, the saving rarely covers the effort of switching.
Customers typically save 30% or more on what they currently pay their delivery network, and the saving grows as the audience grows. We price against what the equivalent unicast delivery would cost you, so the bigger your peaks, the wider the gap.
Notes
- The figures above are list prices. Most broadcasters pay less than list, so the ceiling is not the bill.
- Savings are stated against the equivalent unicast delivery cost and vary with audience peaks.
- It is the delivery leg that changes, not your stack: SmartCast plugs in as a transparent carve-out behind your existing playout and DRM, typically live in four to six weeks.
Five contracts, or one.
Playout, server-side ad insertion, DRM, analytics and the delivery layer itself: one integrated stack, one contract, one console.
What you buy separately today · what SmartPlay covers
- Playout
- SmartPlay playout.
- Ad insertion
- Server-side ad insertion against VAST 3.0 and 4.0.
- Protection
- Widevine DRM with bring-your-own-key for video on demand.
- Measurement
- Join and leave events from the infrastructure itself.
- Monitoring
- A 24/7 network operations centre.
- Delivery
- SmartCast.
Pricing is quoted against your current bill and your peak concurrency; bring both.
The numbers come from the infrastructure
DanceTV, an independent company and a customer of eight years, runs nine channels around the clock to more than 140 countries on SmartCast, per internal analytics.
Every endnode reports join and leave events over a TLS backchannel, so viewer counts, session durations and geography come from the infrastructure itself, not from browser cookies, tracking pixels or third-party scripts.
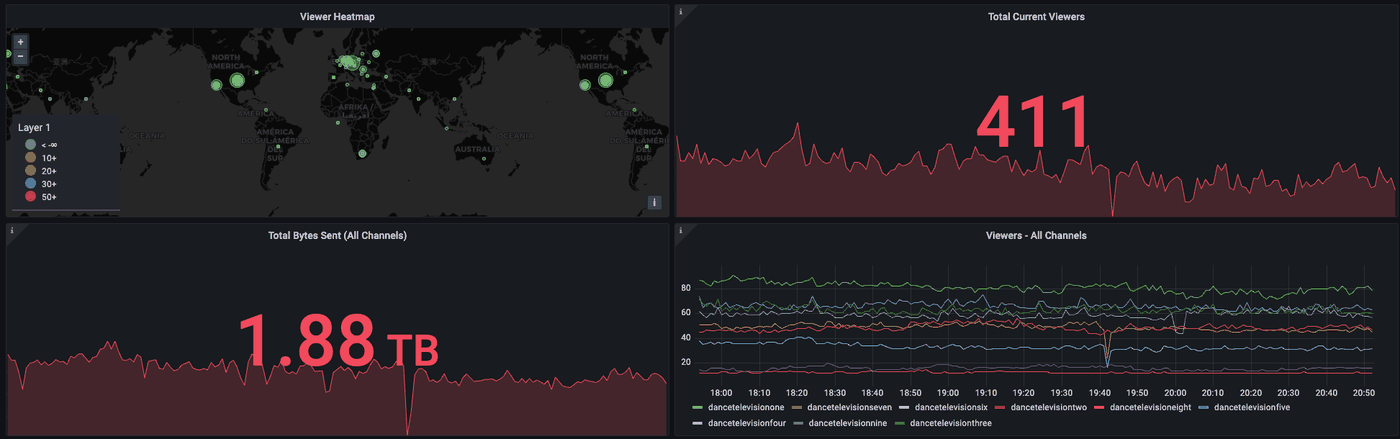
Uptime, reach and viewing figures are per internal analytics; the telemetry record is continuous since 2019 and is opened for diligence on request.
Bring two numbers.
Your current delivery bill and your peak concurrency. Those two numbers are enough for us to tell you whether the saving is worth your time, and to tell you if it is not.